


An estimated 80% of invested resources in software development are squandered by different forms of inefficiency (defects, technical debt, etc.). The inefficiency inherent to software development grows proportionately with the scale of the development organization, which is what allows small, agile startups to disrupt markets so frequently.
Unfortunately, this has long been the status quo–because the overwhelming complexity and lack of transparency made identifying the sources of inefficiencies very difficult. When numerous teams totaling hundreds or thousands of developers are working in hundreds of millions of lines of code, how can one expect them to truly understand the the scope of the code in its entirety?
The first step towards achieving a comparable level of efficiency to that of other departments is to create transparency. Software Process Mining does this through a digital boardroom of KPIs as well as, of course, software maps.
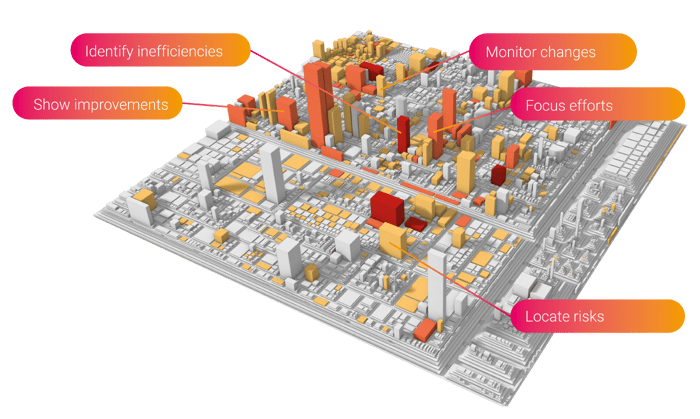
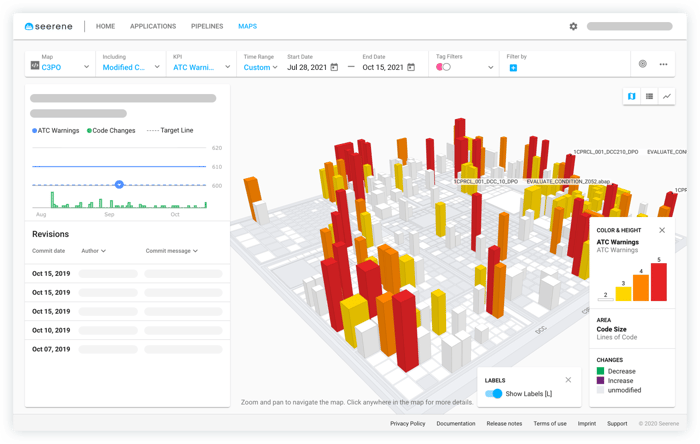
These software maps, reminiscent of cityscapes, visualize the code so that it is intuitively understandable for anyone. Each column represents a program, with the height correlated to the complexity of the code and the shade of red representing the frequency with which changes are required.
Development teams are then able to use the software map to quickly identify areas needing special attention. With the help of actionable insights, developers can drill-down even to the source code so as to quickly and much more easily rectify problems. Managers are then able to easily track progress and code health through the visualizations and KPIs.
Largely due to missing transparency, corporations often struggle also with maintaining accountability – both internally and externally. Internally, this manifests itself in teams that aren't as efficient as they could be or knowledge monopolies that arise and endanger the success of projects and deadlines. Through software visualizations and the accompanying KPIs, management can identify the best-performing teams and spread their best practices throughout the organization. Likewise, if there are areas of code where only one developer is familiar, managers can ensure a better knowledge distribution so that projects aren't at risk should that developer depart from the company.
Many corporations turn to outsourcing for at least part of their software development. As a consequence of the lacking transparency, these companies are unable to check the internal quality of the code delivered. Unfortunately, the delivered software is frequently full of technical debt, which is overly complex code that makes further software development more difficult. As future software developers have to work in this accumulating technical debt, they become less efficient and more prone to making errors.
Software maps and KPIs can radically change the dynamic. Should the received code require additional development, development teams can easily identify and fix problem areas before it is released to the end-user; thereby sparing the company embarrassing recalls or headlines. For more on how software analytics can be applied to technical debt, read this article.
While already powerful on their own, software visualizations are only the start of what Seerene offers. The software process mining platform uncovers hidden inefficiencies so that more of your investments in software development are devoted to value capture, rather than maintenance. The digital boardroom of KPIs provides the data-driven foundation for executives to create a software strategy, without necessarily having a strong tech background. Through the implementation of software visualizations and other software process mining technologies, companies can expect to see gains in productivity of 25% or more.
We'd love to discuss with you how software visualizations and software process mining can help your company unlock its full potential. Let's have a talk:
Discover more about:

