
Across large enterprises, a stubborn share of software investment fails to translate into business value. In many organizations, less than 40% of developer time and budget produces outcomes customers or the business care about; the rest is lost to rework, defect-fixing, below-the-radar activities, and unmanaged complexity. Evidence drawn from large corporate settings suggests that a realistic baseline inefficiency can approach 60% of software spend, with seven- and eight-figure annual consequences for any firm employing thousands of developers. Platforms that create end-to-end transparency—from code and teams up to the executive view—consistently unlock double-digit efficiency gains and can be introduced with minimal friction (often via a lightweight, single-digit-hour technical onboarding and a few minutes of monthly C-level attention). The strategic question for CIOs is no longer whether to measure software production as rigorously as manufacturing; it is how quickly to institutionalize an executive system of record for software that aligns the enterprise around time and money.
Software has been “industrial” for a long time, but executive management practices have lagged behind. Most C-suites can recite cycle times and scrap rates for physical plants; far fewer can point to a single, trusted efficiency metric for the software factory. That gap is strategic. The rise of platform engineering, cloud sprawl, and generative AI has multiplied both leverage and risk. Without an objective, continuous picture of where time and budget go—across portfolios, products, teams, and code—the organization cannot distinguish genuine value creation from effort and motion.
In this context, an executive-caliber transparency layer does three things:
• It translates technical realities into financial and operational terms that leaders can act on—time and money.
• It exposes where value “leaks”: avoidable defects, quality debt, and unsteered work.
• It sets off a “clockwork” cascade of continuous improvement, because the same metric is visible and trusted at every level, from code hotspots to the boardroom.
Consider a representative enterprise with ~1,000 developers and an annual software budget of ~€82.5 million. Using conservative assumptions (150 coding days per developer; €550 all-in cost per FTE day), analyses often surface roughly 60% inefficiency—on the order of 109,500 developer days and ~€60 million per year. The loss is not monolithic: about a third typically sits in defect-fixing, a quarter in low-quality code that slows future work, and the remainder in unsteered activities that never align to business outcomes. Meanwhile, only ~€22 million of the annual spend flows into true “business topics.” None of this is an indictment of teams; it is a management system problem.
This pattern repeats, with scale effects that matter at the top of the house. A 2,000-developer estate leaking 60% of value is losing roughly €120 million annually; an 8,000-developer estate is losing hundreds of millions. These figures are not theoretical models; they reflect what emerges when siloed engineering telemetry is fused into a single executive lens that traces value leakage back to root causes in code and organization.

When a shared, outcome-anchored efficiency metric becomes the “operating language” of the software organization, three reinforcing dynamics appear:
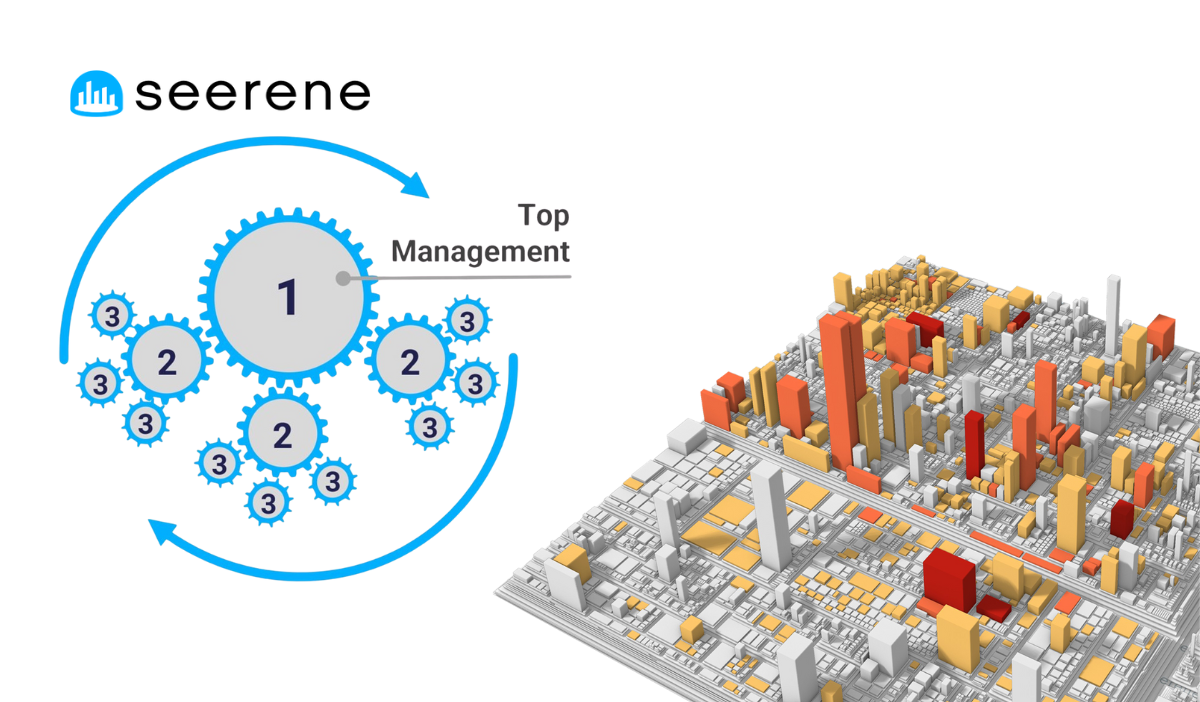
1. Governance without bureaucracy. A single, comparable set of measures across heterogeneous toolchains and units replaces slide-based status rituals. Leaders spend less time interpreting and more time deciding. The mere act of measurement and visibility has a focusing effect; teams align toward the same targets, and local improvements roll up to portfolio outcomes.
2. Kaizen for the digital enterprise. The evolution from shop-floor circles to fully digital, always-on improvement loops makes continuous improvement self-propelling. Teams can view inefficiency in units of time and budget, see hotspots in architecture, and choose the next best move with minimal arbitration. Over time, the organization exhibits “self-healing” behavior as improvement behaviors generalize.
3. Compounding returns. Gains accrue across years. Typical trajectories show cumulative improvements in the high-teens to twenties in year one, with continued compounding in years two and three as structural quality debt is retired and unsteered work is squeezed out. The result is not a one-off cost takeout but a durable productivity reset.
A frequent objection from senior leaders is that they cannot absorb another governance forum. The good news is they do not need to. In mature deployments, the CIO’s monthly time investment can be measured in minutes, not hours. What matters is not more ceremony; it is a persistent, drill-down-capable view that ties portfolio-level efficiency to code-level causality. With that in place, a brief monthly cadence—anchored in exceptions, trend breaks, and business-critical initiatives—can exert outsized influence.
Two design choices make this minimal-time model work:
1. Top-down comparability. The metric is uniform across divisions and products, so leaders can ask “where is the next hour best spent?” rather than “whose dashboard is right?”
2. Bottom-up explainability. Every executive roll-up is traceable to artifacts engineers trust. When a portfolio trend line twitches, the responsible teams can point, within minutes, to the specific architectural hotspots or process patterns driving it.
Large enterprises often fear multi-quarter change programs. That is unnecessary here. Because the raw materials already exist in your development toolchain, the executive view can typically be switched on with very light touch: think single-digit hours of a designated technical point person to establish secure connectors to repositories and CI/build systems, not wholesale process change. From there, you roll out carefully: start with a pilot portfolio, validate that the metric behaves sensibly, and socialize wins.
A pragmatic path:
Phase 1: Establish the baseline. Connect a representative slice of products; quantify current leakage in days and euros; validate with engineering and finance. Expect the first truth-to-power moments: below-the-radar efforts and defect “gravity wells” become visible.
Phase 2: Institutionalize the cadence. Define a single executive page that answers three questions: Where are we today? What moved since last month? What is the next best intervention? Keep the meeting short; let the metric do the work.
Phase 3: Scale and standardize. Expand to critical portfolios and suppliers, codify thresholds and triggers (e.g., trend breaks, efficiency regressions), and integrate the metric into investment cases, risk reviews, and quarterly business reviews. Over time, procurement and finance will treat software efficiency the way they treat unit costs and yields in manufacturing.
The most effective executive measures are disarmingly simple: time and money. Beneath that top line, the system traces inefficiency to the few causes that matter:
• Defect-fixing drag. Excessive downstream fixing crowds out new value.
• Structural code quality issues. Architectural hotspots amplify future effort.
• Unsteered work. Ad hoc or invisible initiatives that never connect to outcomes.
By quantifying each in budget and FTE-days, trade-offs become explicit: retiring a chronic hotspot may return more capacity than any tooling purchase; pruning unsteered work may free enough talent to accelerate a flagship product’s roadmap. The simplicity of the top-level KPI is why it scales; the specificity of the drill-down is why engineers respect it.
Generative AI has intensified the urgency of executive transparency. The promise—faster code, richer tests, accelerated refactoring—is real. So are the risks: quality debt at machine speed, inconsistent usage policies, and opaque productivity claims. The answer is not to slow adoption; it is to measure its effect with the same time-and-money instrumentation used for the rest of the software factory.
Treat each AI intervention as a managed experiment: define the before state, introduce the capability to a bounded scope, and read the deltas in efficiency and quality. If the metric rises and defect gravity falls, scale it. If not, stop. This disciplines AI enthusiasm into a portfolio of evidence-based bets, governed by a metric the board already recognizes.
Real-world corporate analyses show that even modest improvements at enterprise scale produce material financial effects. For a 1,000-developer estate, a conservative recovery of a quarter of lost time and budget can return tens of millions annually—without increasing headcount or velocity pressures that burn out teams. Over a three-year horizon, the gains tend to cumulate as rework drops, quality debt is paid down, and unsteered work is defunded. After year three, the organization’s new baseline simply costs less and delivers more.
Crucially, transparent efficiency is not just a margin story; it is a resilience story. Shorter release cycles, fewer defects, and more predictable delivery expand strategic option value: faster pivots, more confident product bets, and the ability to pull forward growth initiatives without new funding. In industries where “time-to-next-platform” defines competitive half-life, that option value lengthens corporate lifespan.

CIOs often ask whether switching on this transparency triggers disruptive change or compliance risk. In practice, the inverse is true. Because the approach is observability-first—reading from existing, sanctioned systems—it introduces no new developer rituals and can be deployed in alignment with strict security and works council requirements. It changes behavior not by mandate but by measurement: when leaders and teams see the same picture, local, context-aware improvements become the default. That is why the associated change management footprint is surprisingly small: people respond to better information, especially when it is clearly connected to outcomes they already own.
Boards increasingly ask the CIO to translate software spend into enterprise outcomes. With an executive system of record for software efficiency in place, the message can be crisp:
• We have a single, auditable measure of efficiency covering our entire software portfolio.
• We can quantify and localize value leakage, in euros and days, and show month-over-month improvements.
• We govern GenAI impacts empirically, scaling what works and stopping what doesn’t.
• The cadence requires minimal executive time; the organization improves itself between meetings.
Every enterprise has already paid for the data needed to manage software like an industrial process; it lives across repos, pipelines, and work trackers. The differentiator is whether leadership insists on fusing those signals into a common language that the whole organization can see and steer by. When it does, the enterprise recovers capacity it thought it had to buy, accelerates roadmaps without heroics, and transforms software from a cost center narrative into a compounding asset.
The implementation is not a moonshot. It is a decision: to treat software with the same managerial seriousness as the factory floor and to equip the C-suite with a transparent, drill-down-capable view of time and money. In the next strategy cycle, one question belongs at the top of the CIO’s agenda: What would we do with the 20–30% of software capacity we can realistically get back? The firms that can answer—and prove it—will set the pace in the era of AI-accelerated competition.
This article draws on evidence, case data, and implementation patterns from executive-level software transparency programs deployed in large enterprises, including quantified examples of 60% baseline inefficiency, >25% achievable efficiency gains, lightweight onboarding (on the order of hours), and minimal ongoing executive time commitments supported by drill-down to code-level root causes.