
Could Time-Series Analysis Revolutionise the way that Engineers Predict Software Defects?
Written with reference to: Krishna, Agrawal, Rahman et al., (2017) What is the Connection Between Issues, Bugs, and Enhancements? (Lessons Learned from 800+ Software Projects), North Carolina State University, *IBM Corp
_________
It’s only natural to want to understand what lies just ahead in our paths, or indeed further ahead down the line. For the software developer, being able to predict software defects with maximized efficiency and precision could perhaps be considered as one of the holy grails of software development, for the huge amounts of time and costs saved and the ability that it would offer to build reliable software, that will stand the test of time and rigorous use. Looking to the case of the large service organization maintaining suites of software and attempting to effectively manage personnel across projects, this could save huge amounts of resources, and otherwise ensure that they deliver the service that their clients expect of them.
The world of software development may well be a step closer to predicting software defects with new heights of accuracy and efficiency, which rests upon the idea of time-series analysis. In a 2017 study reported by Krishna, Agrawal et al., researchers sought to establish the presence of temporal trends in issues, bugs, and enhancements, with the intention of associating patterns in data with certain periods of time. Should data demonstrate certain patterns in relation to these set periods, the results could be used to predict future trends for same or similar data, over the same periods.
The study used a rolling window method to train an ARIMA (Autoregressive Moving Integrated Average) model on the 20 previous weeks and forecast for a future 4 weeks. This is repeated for issues, bugs, and enhancements. Then, they calculated the magnitude of absolute error (MAE) between actual and forecast values for each period of the rolling window; in other words, calculating whether the relationship between existing data and certain time periods can be accurate in helping us predict the behaviour of future data and future time periods.
Given that the errors for forecasting bugs in 66% of the projects were very small — indeed, close to zero in several cases, — the results seem optimistic for software engineers and data scientists keen to get to know what the future holds. The researchers made the conclusion that data of both proprietary and open source projects exhibit temporal trends, with proprietary projects being slightly more temporal than the open source. By tracing correlations between issues and bugs, enhancements and bugs, and issues and enhancements, the study found moderately correlations between issues and bugs & enhancements. Using a rolling window to create an ARIMA model on issues, the researchers applied that model to forecasting for bugs and enhancements; the rolling window forecasting data patterns for each time step progressed by the window.
For those time steps, they measured the reliability of the predictions by measuring the error between the forecast values for bugs and enhancements, and the actual values of the bugs and enhancements. Very promisingly, the findings summarized that for most projects — both proprietary and open source, — the magnitude of average error was very small, with the magnitude of average errors in proprietary projects being slightly lower than in open source projects. Suddenly, the otherwise untouchable future seems a little closer within reach.
Who wouldn’t like to revolutionize the productivity of their software development? Developers switching between different tasks accumulate time and costs, and the researchers kept this in mind as they moved through the study. The more complex the task, the more time it takes for the developer to make the shift. The more that managers can plan the patterns in data and the tasks that will have to take place, the more that they can plan their developers’ time so that their attention focusses coherently rather than leaping from one odd task to another, which engage completely different sets of ideas and concepts.
When considering the promise offered by this strategy for predicting defects, it’s worth considering whether the effort that would go into implementing time-series analysis at the heart of an organization would be worth the time and costs saved by development teams. The study concludes that ‘Managers need to only track issue trends in projects. With these trends they may be able to forecast the number of future bugs reports and enhancement requests.’ Indeed, the slightly greater accuracy of using issues and time-series analysis to predict defects for proprietary software holds great potential for large companies and organizations with large teams and expansive codebases that require constant, careful maintenance.
So, what’s left for a company to find is the clearest, most efficient manner of identifying issues and issue trends, and then the ability to understand these trends within a given time bracket. By highlighting issues and tracking their evolution over time, a Software Map could work in conjunction with the very same kind of time-series analysis adopted at the heart of this study. By offering the ability to simultaneously trace connections between any given issue, bugs and enhancements, and to see how each of these factors interacts with the other over any selected period, the map covers the element of work involved in deriving and understanding the trends by analyzing and presenting this data in a clear, visual format.
The maps also live up to this promise in actual practice, as demonstrated by a collaborative study between Software Maps and a reputed financial firm which found that data about known bugs and issues could be mapped successfully to relevant code; i.e., the data that time-series analysis would otherwise provide. Several issues were mapped to the same code units, as multiple issues could address different matters of concern to the company in the same code area. In doing so, they hoped to gain knowledge that would enable them to reduce the areas of code needing to be reviewed, so alleviating the strain of delays on a company whose activity is already resource-intensive and reducing their reliance on existing functionality.
Having mapped the data to the code units, the company managed to observe the areas of code with the highest bug score, as well as analyze a history of their developers’ activities and derive precise training requirements within people dimension analysis. By tracing developers’ footprints, the company found that they could predict where issues might reoccur, and otherwise refine the process of on-boarding new team members.
In total, 5,939 units and 9,782 units were analyzed in the different subsets of Android source code used by the company, and 412 code units could be mapped to the 119 issues with 58% of the code units with an issue score being identifiable by software experts. Between the software experts and the company, 50% of the code units were identified as having potential issues, indicating how such a method could assist developers with improving the efficiency of predicting defects for half of a codebase; an enormous amount of equivalent work in the event that these bugs would have had to have been fixed in the traditional way.
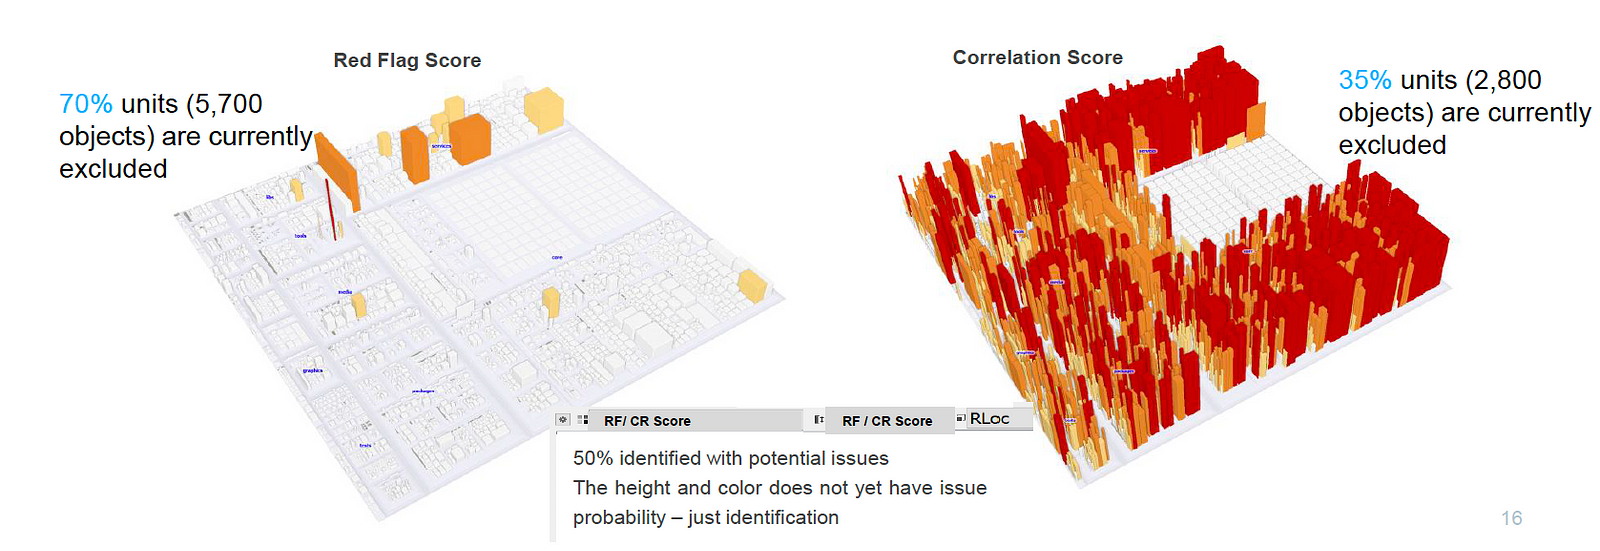
Examples of the maps used in the study for issue-prediction for code units. Given the quantity of units excluded alongside the fact that already half of the units analyzed were found to have potential issues, this suggests that it could be well worth pursuing further analysis and refinement of the process in order to be able to analyse the full codebase, for the number of issues that the currently excluded units might contain.
Worth noting, that this study found that not all records could be mapped; 70% of the total number of code units were excluded in the studies conducted by the software experts, and 35% of the code units were excluded in those conducted by the company, and not all issues were identified. Looking beyond these matters that can improve with time and further practice, the most crucial finding involved the way that the map visualisation applied itself to time-series data to produce findings that could, with further analysis to ensure full accuracy, be relied on by companies seeking to reduce their quantity of bugs and understand how developers are relating to bugs in their work. Indeed, it was found that a better score methodology and mapping of scores provided by the Software Map to the score given for the bug could be developed over time, offering a promising glance on time-series analysis as a means of transforming the efficiency of detecting issues.
Given the fact that Software Maps can already attach syntactical meaning to a given period of time indicates that the maps could adapt themselves easily to the concept of a rolling time window, enabling software development teams with the knowledge and summaries required for seamless processes of time-series analysis. With this, the ability to predict coming trends in bugs and enhancements, and software development that reaches new heights of conceptual efficiency.