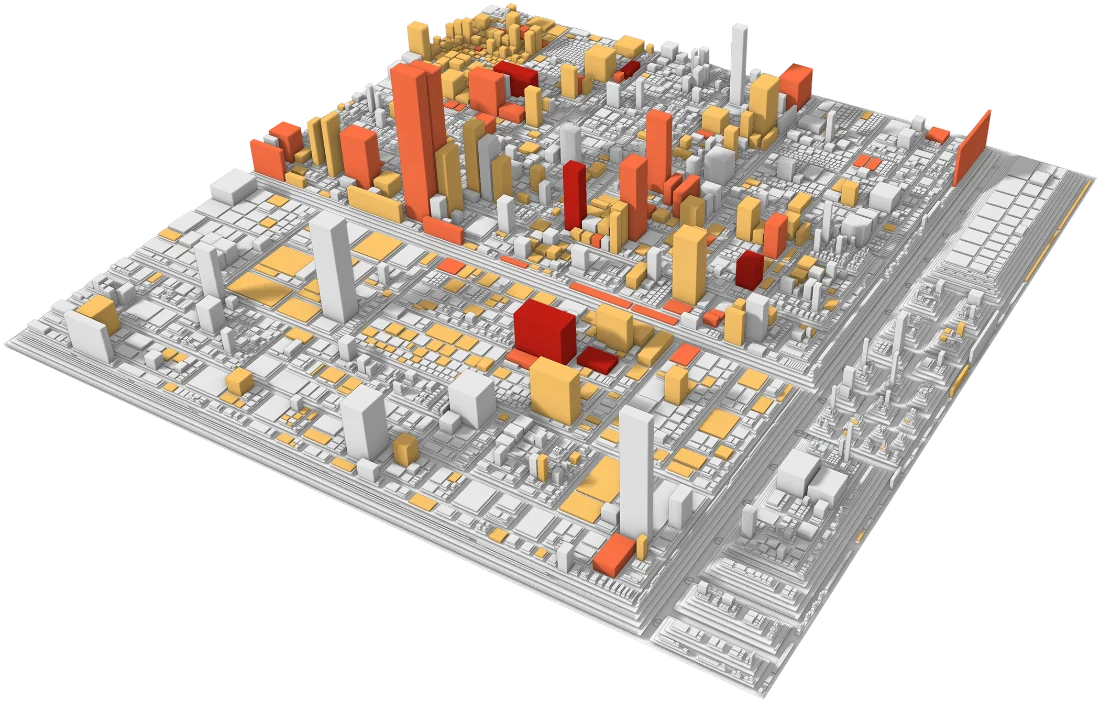
The platform
A management view of software production, traceable to its causes.
The Digital Boardroom connects the questions leadership has to answer with the evidence that sits in your engineering toolchain. Every figure is comparable across product lines, teams and partners, and every figure opens to the system and team-level cause behind it.
Why existing tools do not produce this view
More tooling creates more local signal, not a management view
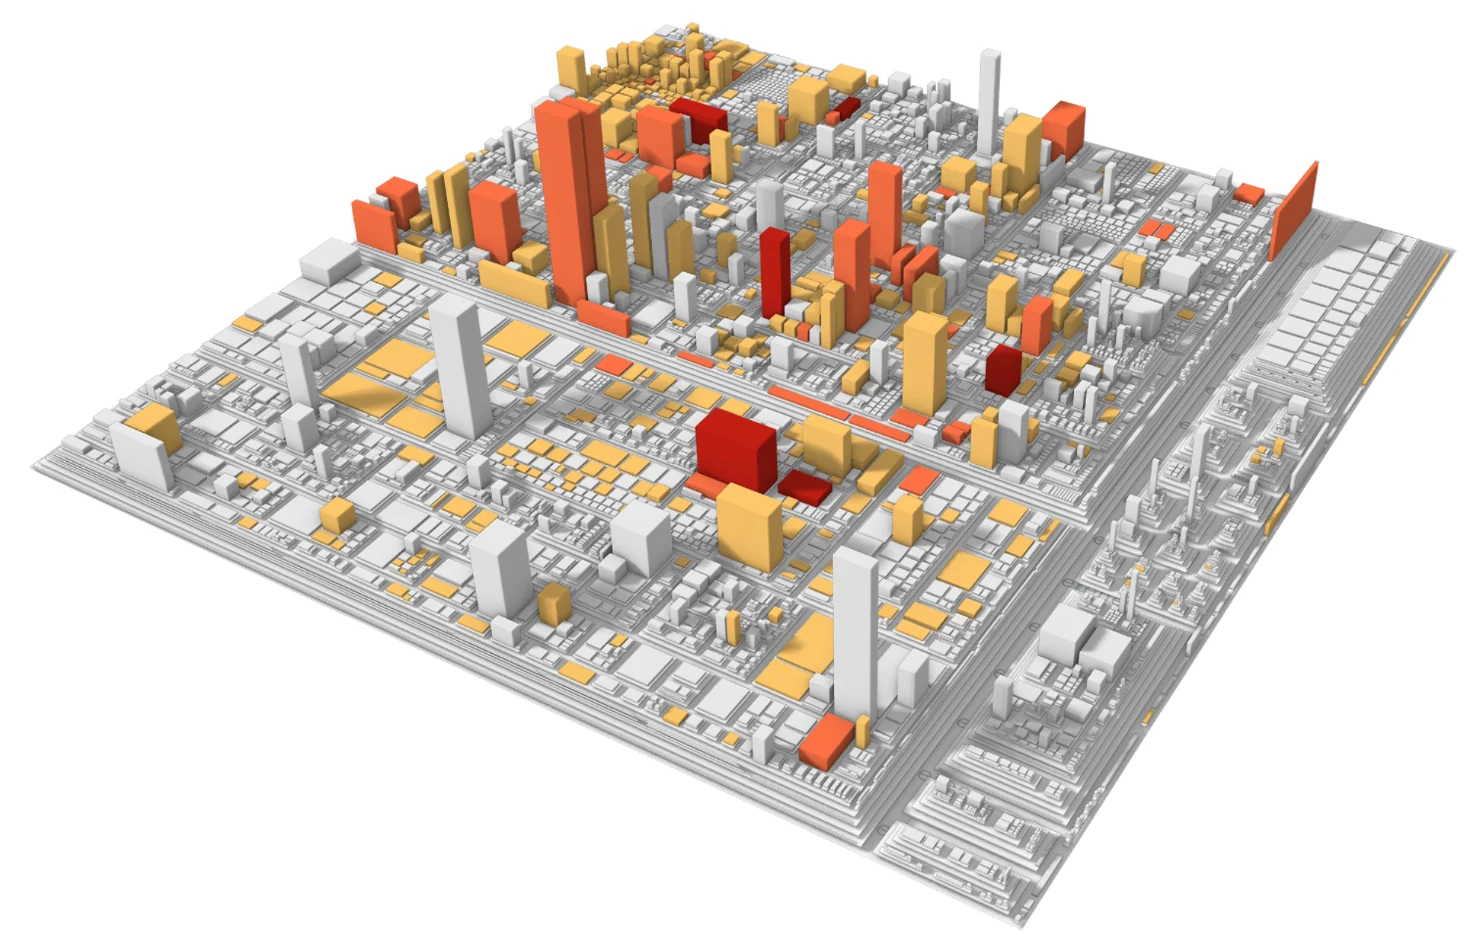
Large engineering organizations already run sophisticated toolchains, often several per segment across vendors and product lines. Each produces a faithful local picture, and some organizations consolidate them across teams. What rarely emerges is a consistently defined, traceable answer to a portfolio-level question such as where capacity is bound or which system carries structural risk for the business.
Code quality tools, project tracking, CI/CD analytics and engineering dashboards each have their own perspective and their own unit of measurement. Internal BI and management reports stitch some of this together by hand, at a point in time, with definitions that differ from one business unit to the next. The result is the familiar gap between green status reports and a different reality in the codebase.
Seerene adds the shared evidence layer above the band, not another tool in it. It fuses and homogenizes the traces the tools already record into one connected view of rework, defects and complex code across the delivery flow, read-only, with definitions that hold across languages, vendors and methods, and read from the management question downward rather than from the tool upward.
What Seerene adds
How the information space emerges, bottom-up
Four steps from the traces your tools already record to one governable picture: read, connect and normalize, add the organization’s context, one information space on the three axes of the gap. Nothing is replaced or re-entered. Scroll to open the stack.
- 01Read
Every production line leaves traces in its tools: commits, work items, builds, tests, defects. Seerene reads them, read-only, metadata only.
- 02Connect and normalize
Different tools record work in different ways. Seerene connects these traces and puts selected indicators on shared definitions, with the context of each system and team. Leadership can compare the portfolio and trace a figure back to its evidence.
- 03Add context
Teams, components, products, business units, sites and partners are mapped on top, so every figure aggregates to each management layer.
- 04One information space
Every management figure stays traceable to its engineering evidence and explorable at every level. The Digital Boardroom provides the views on it.
Bottom-up: tool knowledge, software production lines, the Seerene Analytics Layer that fuses their signals, the Software Evidence Layer, the management pyramid on top. The paths show the traces converging into one definition and rising to the apex.
The model
How the view is built: three axes, one production line, one definition
The model behind every Digital Boardroom view. Three axes structure the information space; every production line runs the same flow and leaves traces in its tools; selected indicators are put on shared definitions with the context of each system and team.
From one-dimensional tool views to three-dimensional software governance.
Every production line runs its own flow and leaves its traces in its tools. Point tools illuminate stages of one line. Seerene connects all three axes: one Evidence Layer, one comparable portfolio view, one evidence path for every management level.
X · Development flow
End-to-end visibility
See delays and rework across the development flow, from requirement to running software.
On the modelAlong each production line, from requirements through code, build and test to run.
TodayPartial. Inside one line a tool sees its stage, sometimes the next one; the definitions differ from tool to tool.
The three axes are the structure of the view. What the view shows are the decision dimensions: cost, capacity, quality, risk and business value, with AI impact as the current lens, on the same definitions at every level.
The structure of the information space: X along one production line, Y across lines 1…N, Z from the lines up through the management levels. Select an axis to mark it on the model.
Useful signals. Partial connections. An incomplete portfolio view.
Today’s tools already connect some stages, and some organizations consolidate them across teams. What often remains fragmented is a consistently defined, traceable view across production lines and management levels. Seerene adds that shared evidence layer.
Switch the state to see the same signals as they are connected today and with Seerene.
Today: these signals, each in its own tool with its own definitions. Dotted magenta marks where tools already connect adjacent stages inside a line. What often remains fragmented is a consistently defined, traceable view across production lines (Y) and management levels (Z).
Cyan the development flow, left to right · pink rework, always back against the flow: the later a defect is found, the longer the loop · every step leaves metadata in repositories, tickets, pipelines and test systems.
Every production line runs the same flow. Seerene reads what it leaves behind.
A software production line is a software system with its engineering teams: from requirements through code, build and test to running software. Local tools see the steps, not the friction between them. The pyramid is built bottom-up from what every line already records.
Work itemsJira · ALM
CommitsGit
Builds and testsCI/CD · test management
Shared definitions + system context
One definition per selected indicator; the system, team and partner behind each figure stay attached.
Production line 1Rework share of capacity · same definitionContext: Customer portal · its teams
Production line 2Rework share of capacity · same definitionContext: Payments platform · its teams and partner
Nothing is replaced or re-entered. Engineering validates the interpretation; leadership sets priorities.
Further reading in CIO
Herausforderung für CIOs: Die Ära der Software Factory
Oliver Viel · 9 November 2020 · German · article by Seerene’s Chief Communication Officer
Read the article →
Traceability
From the board question to the cause, and back
A management figure is only useful if engineering can verify it. The trace from question to cause is part of every view.
- 01Management question →
- 02Portfolio view →
- 03Production line →
- 04System →
- 05Team-level cause →
- 06Decision and owner →
Causes are expressed at team and system level: rework after late integration, a component that few people can change, a dependency that stalls three teams at once. There is no individual performance scoring, no developer ranking and no personal attribution. Seerene measures the production system, not the people in it.
The one question
Are we getting better or worse as a whole — and where?
The question a portfolio owner cannot answer from reports. The Digital Boardroom answers it as a trend of the same perimeter: the share of capacity reaching new value, the rework share and the number of structural hotspots — change since your previous management review, at your management cadence, per production line and for the portfolio, with the effect of a changed portfolio mix shown separately from the change inside the lines.
Six mechanisms behind the view
What the Evidence Layer computes so that the five dimensions can be read on one basis.
Operating layer above the toolchain
One model across repositories, pipelines, trackers and test systems, across programming languages, vendors and methodologies, so that a figure for one product line means the same as for the next.
Capacity attribution
Effort split into product work and work absorbed by rework, dependencies and coordination, per component and production line, in developer-days and budget.
Structural risk mapping
Knowledge concentration, change failure and aging components mapped to the business criticality of each system, so that risk is read where it matters.
AI impact observation
Throughput, review effort, rework and quality before and after AI adoption, where usage data is available. Observed change is kept apart from proven cause; a causal AI return needs a proper comparison design, which the baseline can set up.
Comparable management KPIs
The same definitions at every level, from board view to team view, so that a number does not change meaning on its way up the hierarchy.
Decision tracking
Question, finding, decision, action, owner and review date are documented together, so that the next review checks effect instead of restarting the debate.
The economic lens
Where funded capacity goes, and what a redirected share is worth
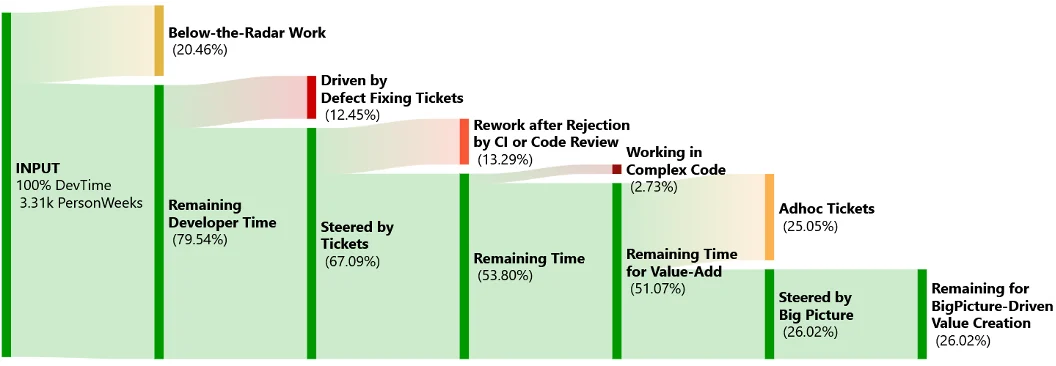
100 % is the engineering capacity you fund. Necessary maintenance stays; avoidable rework and friction is the share that can be redirected, and plan-vs-actual cannot show it. The arithmetic follows the executive briefing.
Funded engineering capacity · 100 %
Planned new functionality
Absorbed before planned product work
Illustrative assumption. Absorbed capacity includes necessary work and avoidable friction; their split is not quantified. The baseline establishes the recoverable share.
What would redirected capacity be worth in your organization?
Use the existing calculator to adjust organization size, cost and assumptions. The baseline then tests your actual capacity profile.
Illustrative, not a benchmark: baseline analyses of large software organizations showed ranges of 20–40 % of capacity reaching new functionality and 60–80 % going to maintenance, rework and friction, partly necessary, partly avoidable. Your actual mix and the recoverable share come from your baseline. Capacity is not cash savings; no causal AI effect is implied.
Questions technology leaders ask first
Does this replace our existing engineering tools or dashboards?+
No. Seerene reads from them and adds the portfolio-level model and the management view they cannot produce on their own. Teams keep working in their tools.
Does Seerene need access to our source code?+
No. Seerene reads metadata traces from your toolchain, read-only: version-control history, work items and defects, requirement links, CI and test results. Source code never leaves your environment. The exact scope of access is agreed per source during technical validation and documented.
Can this be used to assess individual developers?+
No. Individual scoring and ranking are excluded by design, not by policy: the unit of governance is system, team and portfolio. Aggregation and access rules are agreed with IT security and the works council before the baseline starts.
How does Seerene handle AI-generated code?+
Seerene observes the effect of AI adoption on the production system: throughput, review effort, rework and quality over time, connected to usage data where you have it. It does not claim to detect AI-written code from repository activity, and it separates observed change from proven cause.
What does our organization have to provide?+
A sponsor with your mandate, your management question and one technical contact: typically 8–16 net working hours in total for the read-only connection, a typical value, not per source system, confirmed in the technical validation call. Security review, procurement and works council alignment are planned with you and run in parallel.